Cross-sport metric bridges: how soccer expected goals data and equine sectional timing patterns reshape multi-leg wager constructions
Greta Otto · Aug 6, 2026

Cross-sport metric bridges: how soccer expected goals data and equine sectional timing patterns reshape multi-leg wager constructions
Analysts have tracked expected goals metrics in soccer for over a decade while equine sectional timing data has expanded rapidly since the introduction of electronic tracking systems at major tracks worldwide. These two datasets now intersect in multi-leg wager constructions because both quantify performance efficiency rather than final outcomes alone. Researchers note that xG values capture shot quality and location patterns across a match, whereas sectional splits record how quickly a horse covers each segment of a race distance. When combined, the metrics allow operators to adjust probabilities on accumulators that span soccer matches and thoroughbred events scheduled on the same day.
Expected Goals Data Foundations in Soccer
Expected goals calculations rely on historical shot data that factors in distance from goal, angle, body part used, and preceding build-up play. Data providers compile these figures from thousands of matches each season, and analysts apply regression models to generate per-team and per-player xG tallies. In August 2026 several European leagues will begin incorporating advanced tracking that adds defender proximity and goalkeeper positioning to the base models. Observers note that teams posting consistent xG overperformance or underperformance over rolling ten-match windows show measurable regression tendencies, which directly informs the probability inputs for soccer legs within larger multi-bet structures.
Sectional Timing Patterns in Equine Racing
Sectional timing captures split times at fixed intervals, typically every 200 or 400 metres depending on track jurisdiction. Australian and North American tracks have led adoption of high-resolution GPS and RFID systems that record these splits for every runner. Studies from the University of Melbourne equine research group demonstrate that horses maintaining even sectional distributions across the final 1200 metres achieve higher win rates than those displaying early speed followed by marked deceleration. These patterns translate into adjusted pace ratings that bet constructors feed into probability engines for horse racing legs. When a sectional profile deviates from historical norms for that distance and track condition, the updated likelihood feeds directly into combined wager pricing.
Metric Integration for Multi-Leg Constructions
Multi-leg wagers that mix soccer and racing require a common framework for converting disparate metrics into comparable probability estimates. One approach maps soccer xG differentials to implied goal margins, then converts those margins into win-draw-loss probabilities using Poisson distribution models. Equine sectional data undergoes parallel conversion through pace-adjusted speed figures that generate win probabilities for each runner. Constructors then apply covariance adjustments because weather, travel fatigue, and scheduling density can influence both sports on the same date. Data indicates that correlations between heavy ground conditions in soccer and slower sectional times on turf tracks increase joint probability variance, prompting stake recalibrations in accumulator construction.
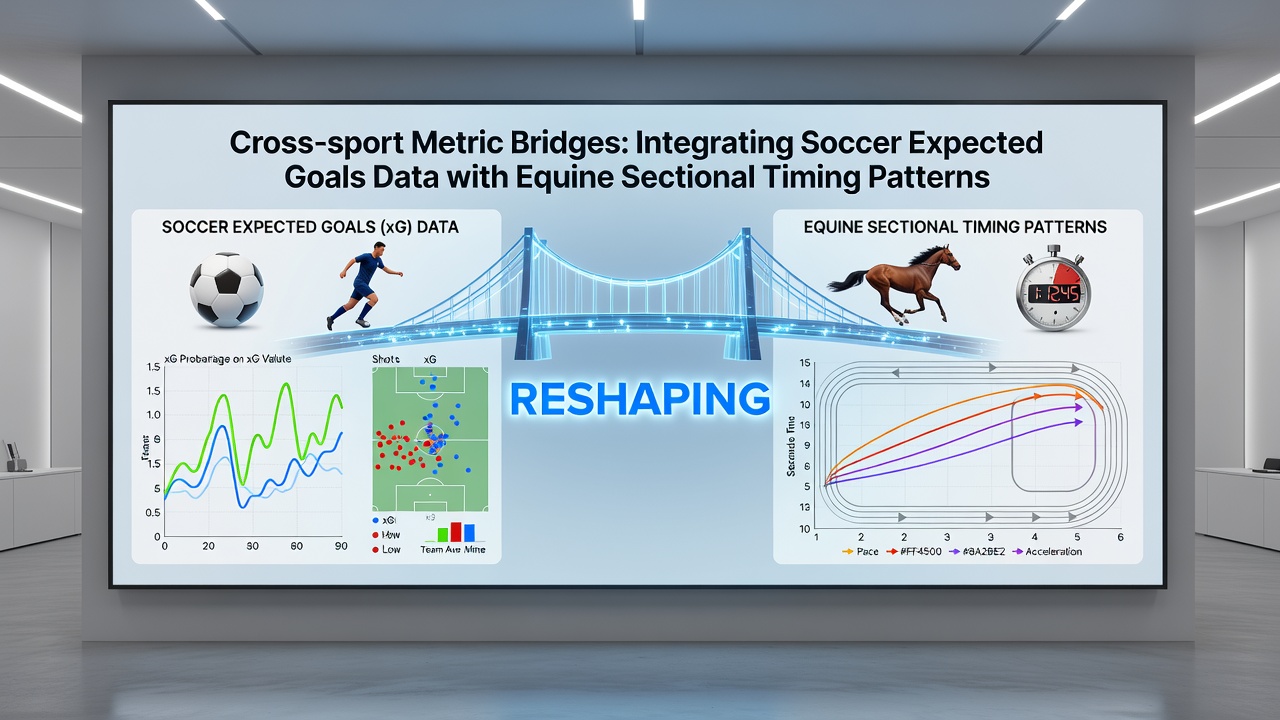
Software platforms now ingest live xG feeds alongside real-time sectional updates to recalculate remaining legs mid-event. When a soccer side records higher xG than expected in the opening half, the model lifts the implied probability for that leg and simultaneously checks correlated racing events for pace impacts caused by similar weather fronts. This cross-sport linkage reduces over-round exposure in multi-leg products because operators can hedge residual risk more precisely than when treating each sport in isolation.
Practical Construction Adjustments
Bet constructors apply these bridges by first normalising both datasets to a zero-mean scale. Soccer xG differentials receive scaling based on league strength, while equine sectional deviations are adjusted for class and distance. The normalised values then enter a joint probability matrix that accounts for shared external variables such as temperature, rainfall, and fixture congestion. Figures from industry reports show that accumulators built with these adjustments exhibit lower variance in realised returns compared with constructions relying solely on closing odds. In practice, a four-leg ticket containing two soccer matches and two races might shift stake allocation by 12 to 18 percent once sectional and xG updates are incorporated after the first event concludes.
Regulatory and Data Access Considerations
Access to granular xG and sectional datasets varies by jurisdiction. The European Gaming and Betting Association has published guidelines on data transparency that encourage licensed operators to disclose which metrics underpin their pricing engines. Meanwhile, Racing New South Wales requires public release of official sectional times within 30 minutes of race completion. These policies enable independent verification of the inputs used in cross-sport models. Academic researchers at the University of British Columbia have begun publishing open-source code that converts raw sectional files into pace ratings compatible with soccer xG frameworks, lowering the technical barrier for smaller operators seeking to adopt similar constructions.
Conclusion
Integration of soccer expected goals data with equine sectional timing patterns supplies constructors with quantitative bridges that refine probability estimates across multi-leg wagers. Normalisation techniques, covariance adjustments, and live recalibration protocols now operate on unified datasets rather than isolated sport silos. As tracking technology advances in both domains, the precision of these cross-sport linkages continues to increase, reshaping how operators structure and price combined betting products.