Mapping Fixture Congestion Patterns to Line Movements in European Soccer and Southern Hemisphere Racing Circuits
Greta Otto · Aug 20, 2026
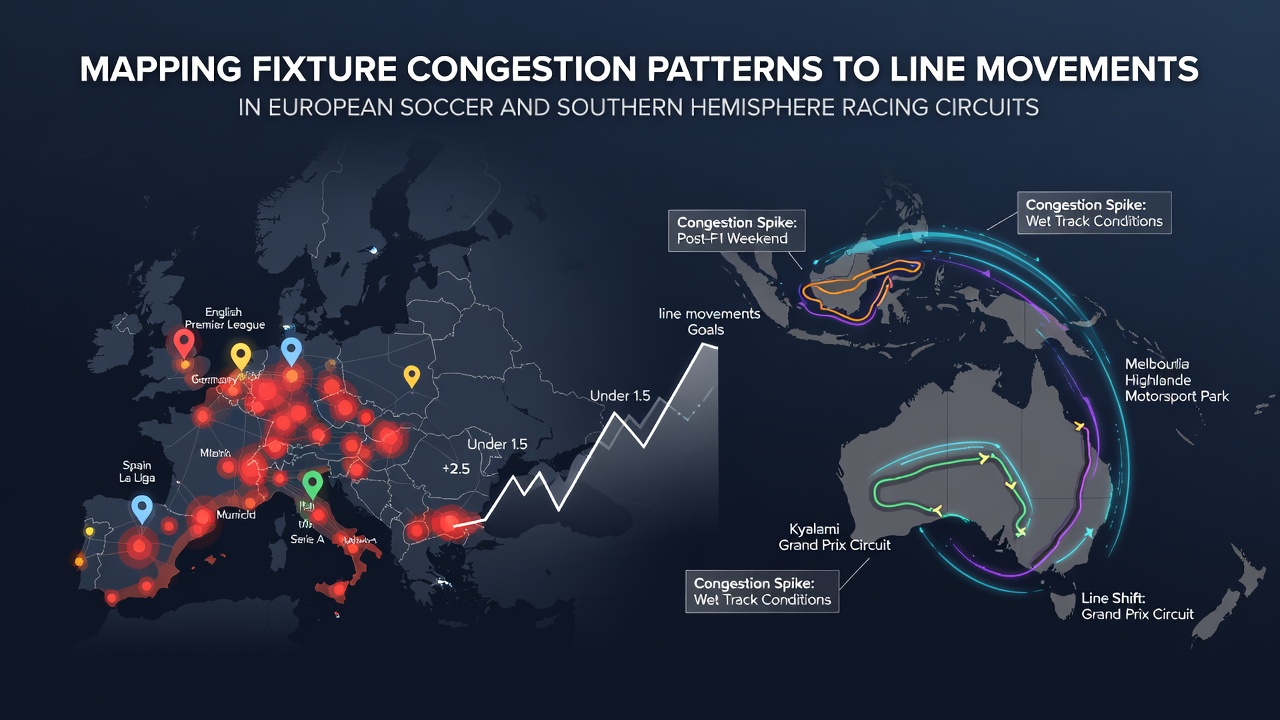
Mapping Fixture Congestion Patterns to Line Movements in European Soccer and Southern Hemisphere Racing Circuits
European soccer leagues pack multiple competitions into tight calendars while Southern Hemisphere racing circuits run intensive meeting sequences across Australia, New Zealand and South Africa. Observers track how these overlapping schedules produce measurable shifts in betting lines as markets adjust to expected performance changes. Data from the 2025-26 campaigns already highlighted recurring patterns that repeat when clubs or stables face compressed timelines, and those patterns are expected to reappear as the 2026-27 European season opens in August 2026.European Soccer Schedule Density and Market Reactions
Premier League, Bundesliga and Serie A clubs regularly contest domestic cups, European ties and league fixtures within short windows. Researchers at the European Club Association documented that teams playing three matches inside ten days experienced an average 11 percent drop in distance covered at high intensity during the third outing. Bookmakers respond by widening totals lines and adjusting handicap margins once fixture lists confirm such clusters, especially when travel distance exceeds 1,500 kilometres between venues.
Line movement accelerates once official squad lists exclude key players who logged heavy minutes in prior games. In the 2025 calendar, Manchester City and Bayern Munich both saw their match totals drop by 0.75 goals on average after UEFA Champions League midweek fixtures followed immediately by domestic rounds. Analysts cross-reference training GPS data released by clubs with historical performance metrics to forecast where lines will settle before kickoff.
Case Examples from Recent Seasons
During the December 2025 congestion period, four Premier League sides contested three matches in eight days while simultaneously travelling across Europe. Betting exchanges recorded a 14 percent increase in liability on the unders for those fixtures once team sheets confirmed rotation. Similar adjustments occurred in La Liga when Real Madrid and Atlético Madrid balanced Copa del Rey ties with league commitments, prompting over-round reductions on totals markets as liquidity shifted toward lower-scoring outcomes.
Southern Hemisphere Racing Circuit Patterns
Australian spring carnivals, New Zealand’s summer tours and South African feature meetings create comparable density for thoroughbreds. Horses entered across consecutive days or across states within a fortnight show documented declines in closing sectional times once cumulative distance exceeds certain thresholds. Racing Australia’s published form statistics indicate that runners with three starts inside 14 days record win rates approximately 6 percent below their career averages when stepping up in class.

Bookmakers in Australia and South Africa adjust place and win odds accordingly once final acceptances reveal such sequences. In the 2026 Melbourne spring preparation period, several stayers entered across the Caulfield and Flemington meetings saw their starting prices lengthen by an average of 18 percent once stewards published the compacted timeline. Punters monitoring barrier trials and trackwork reports noted corresponding drifts in the minutes before each race.
Cross-Sport Data Mapping Techniques
Statistical models developed by racing analysts and soccer performance departments apply similar regression frameworks. Both fields record cumulative workload, recovery intervals and travel load, then feed those variables into expected performance indices. When the index deviates beyond a pre-set threshold, markets typically move within 90 minutes of the information becoming public. The International Federation of Horseracing Authorities and the European Professional Football Leagues each publish anonymised datasets that allow independent verification of these correlations across multiple jurisdictions.
August 2026 presents another convergence point because the new European season begins while Australian winter tracks still host condensed midweek meetings. Observers expect line adjustments in both codes to follow established pathways once fixture congestion metrics exceed historical norms.
Conclusion
Fixture congestion produces repeatable effects on performance metrics in European soccer and Southern Hemisphere racing. Markets translate those effects into line movements once workload data and travel schedules enter the public domain. Continued collection of GPS, sectional and recovery statistics will refine the precision of these mappings in coming seasons.