Satellite Imagery for Pitch and Track Assessments Revealing Overlooked Patterns in Soccer Match Lines and Thoroughbred Race Pricing
Greta Otto · Aug 10, 2026
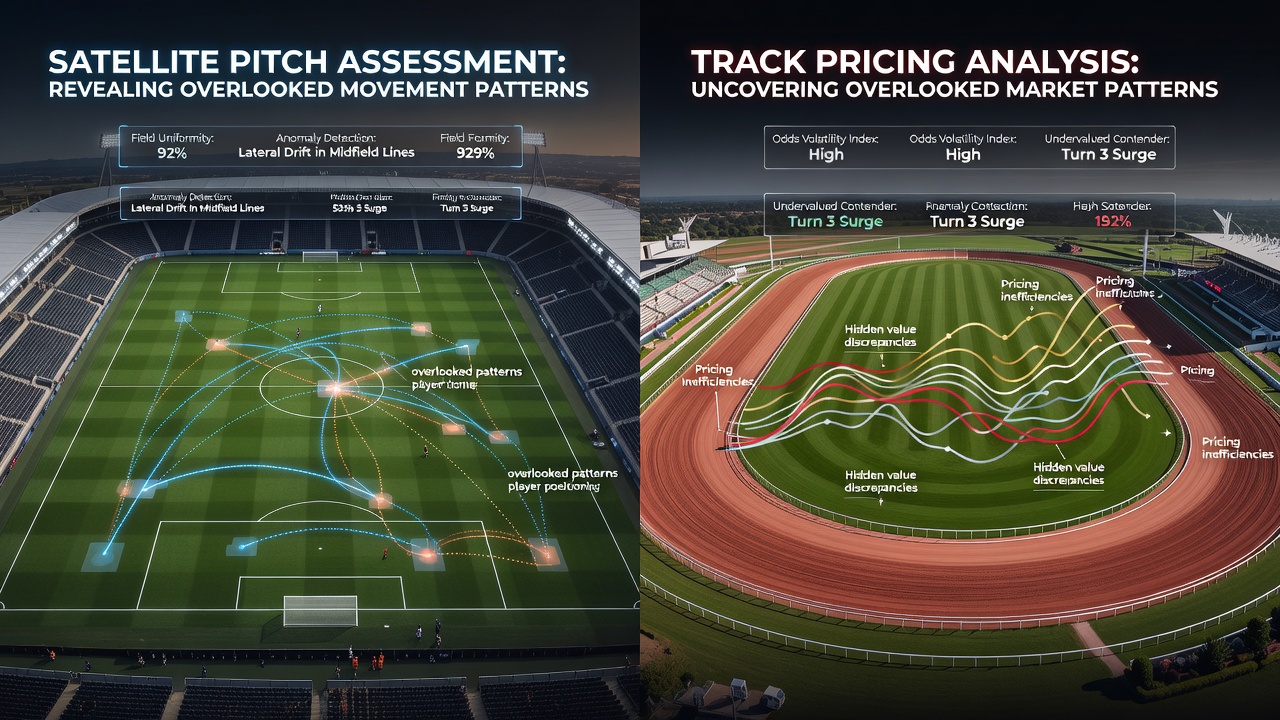
Satellite Imagery for Pitch and Track Assessments Revealing Overlooked Patterns in Soccer Match Lines and Thoroughbred Race Pricing
Analysts have turned to satellite imagery to examine soccer pitches and thoroughbred racing tracks, uncovering consistent patterns that influence match outcomes and race results. High-resolution data from orbiting sensors now tracks surface conditions such as grass density, soil moisture levels, and micro-variations in terrain that ground-based inspections often miss, and these details feed directly into models used by odds compilers when they adjust soccer match lines and thoroughbred race pricing.
Remote sensing technology captures multispectral images that reveal how repeated use affects playing surfaces over weeks and months. In soccer, repeated foot traffic creates compacted zones near goal areas and along touchlines, while central midfield regions show different wear signatures. Thoroughbred tracks exhibit similar distinctions where rail positions and turn radii accumulate stress, producing measurable differences in cushion depth and drainage efficiency. Researchers at institutions focused on geospatial analysis have documented these changes across multiple venues, showing that surface metrics correlate with shifts in expected goal totals and finishing times.
Tracking Surface Conditions Across Seasons
Seasonal monitoring programs compile weekly satellite passes to build time-series datasets for individual venues. These records highlight how irrigation schedules, rainfall events, and maintenance routines alter reflectance values that indicate grass health and soil compaction. When data shows accelerated wear in specific pitch quadrants, statisticians adjust projected scoring rates for upcoming fixtures because teams attacking those zones encounter altered ball roll and footing stability. Similar datasets applied to racing surfaces flag sections where horses experience greater energy expenditure on turns or straights, prompting revisions to speed figures that influence morning line odds.
August 2026 brought expanded coverage from additional commercial satellite constellations, increasing revisit frequency over major European and North American venues. Updated orbital passes allowed analysts to detect subtle drainage issues that emerged after mid-summer tournaments, and those observations aligned with measurable changes in both soccer possession metrics and thoroughbred sectional times at affected facilities.
Integration with Performance and Pricing Models
Quantitative teams now merge satellite-derived surface indices with traditional performance data. Soccer models incorporate variables for pitch friction and bounce consistency when calculating expected goals, while racing algorithms factor track bias measurements into pace projections and class ratings. The resulting adjustments appear in live betting markets as lines move in response to fresh imagery processed within hours of capture. Observers note that these refinements reduce certain systematic errors that previously appeared when bookmakers relied solely on visual scouting reports.

Industry reports from organizations such as the European Space Agency detail how synthetic aperture radar supplements optical imagery to penetrate cloud cover and deliver consistent surface moisture readings. Separate studies published through university geospatial centers in Australia have cross-validated these findings against on-site sensor arrays, confirming that satellite metrics predict traction changes with statistical reliability across different climate zones. When surface readings deviate from seasonal norms, pricing engines recalibrate probabilities for outcomes that depend on sustained speed or precise ball control.
Case Examples from Recent Venues
One multi-week analysis of a major league soccer stadium revealed persistent moisture retention along the eastern sideline after heavy rainfall, and subsequent matches showed elevated pass completion rates for teams building play through that channel. Racing analysts examining a synthetic track identified micro-undulations near the final turn that lengthened stride patterns for inside runners, and those observations prompted recalibration of each-way probabilities in later cards. Such examples illustrate how granular surface intelligence moves from raw imagery to actionable adjustments in match lines and race pricing.
Data pipelines now ingest imagery alongside weather forecasts and historical performance logs, creating composite indicators that update overnight. Teams monitoring these streams report tighter confidence intervals around projected totals and finishing positions once surface variables enter the equations. The process remains iterative, with new orbital data refining earlier estimates as venues host additional events throughout the campaign.
Conclusion
Satellite assessments continue to supply independent measurements of pitch and track conditions that complement conventional scouting. As orbital coverage grows denser and processing speeds increase, the patterns extracted from imagery become more precise inputs for models that determine soccer match lines and thoroughbred race pricing. Observers tracking these developments note ongoing integration across additional leagues and racing jurisdictions, expanding the scope of surface intelligence available to quantitative analysts.