Social Media Analytics Exposing Gaps Between Perception and Reality in Underdog Football and Longshot Racing Bets
Klara Baumann · Jul 13, 2026
Social Media Analytics Exposing Gaps Between Perception and Reality in Underdog Football and Longshot Racing Bets
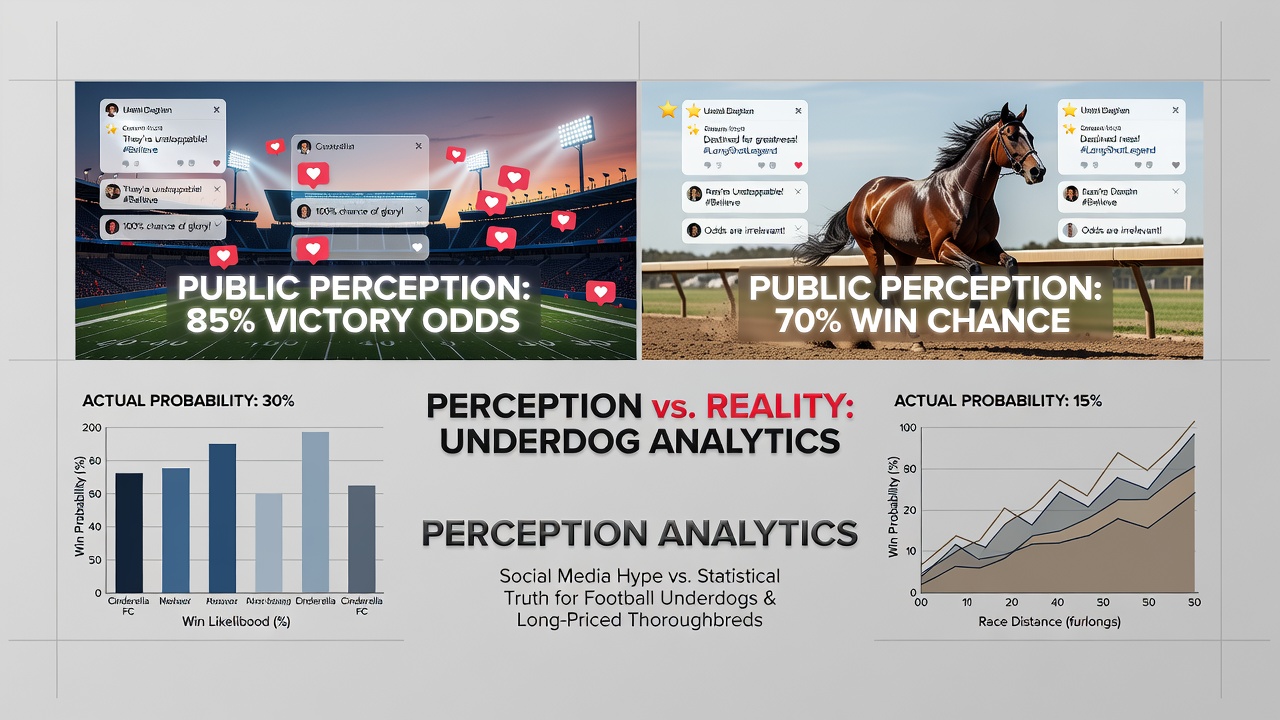
Analysts tracking social media platforms during major football tournaments and thoroughbred racing meets have documented consistent mismatches between online buzz and statistical outcomes, particularly when underdog teams or long-priced horses generate disproportionate attention. These patterns emerge from aggregated data across platforms where sentiment scores rise sharply around certain fixtures while betting markets and historical models assign lower probabilities of success.
Tracking Sentiment Versus Statistical Baselines
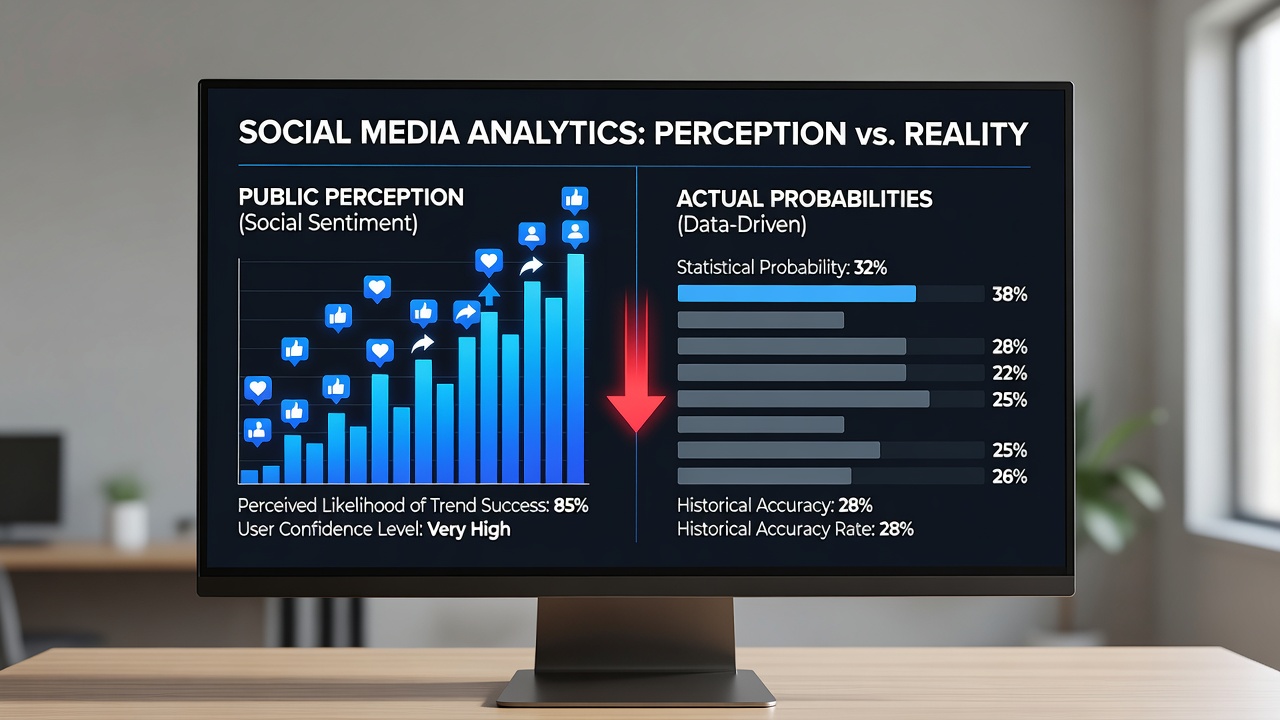
Researchers compile posts, mentions, and engagement metrics from multiple networks then cross-reference them against performance databases and probability models derived from past results. In football, this approach reveals that teams with strong social media followings but modest league positions often attract inflated public support, which in turn influences betting volumes without altering underlying win rates. Data from the 2025-2026 season showed several lower-table sides receiving higher mention volumes than mid-table counterparts ahead of key matches, yet their actual points-per-game averages remained aligned with pre-season forecasts.
Thoroughbred racing presents a parallel situation where long-priced runners in major stakes races draw outsized discussion after strong workouts or notable pedigree mentions circulate online. Platforms record spikes in conversation volume that exceed those for shorter-priced favorites, even though historical strike rates for horses at similar odds remain low. Observers note that these conversations frequently reference recent form or trainer comments rather than comprehensive speed figures or sectional data.
Football Underdogs and Online Amplification
During the group stages of international competitions extending into July 2026, analysts recorded elevated hashtag activity around several debutant national teams that had qualified through regional playoffs. Social listening tools captured thousands of optimistic posts projecting deep tournament runs, yet match simulation models placed their advancement probabilities below 15 percent in most scenarios. These discrepancies appeared most pronounced when teams featured players with large personal followings on major platforms, where individual narratives overshadowed collective performance metrics.
League matches in European domestic competitions have produced similar findings. Lower-ranked clubs playing at home against established sides generated substantial pre-match discussion when key injuries or weather factors entered the conversation. Yet aggregated results from comparable fixtures across five seasons indicate that such conditions rarely shift win probabilities enough to justify the volume of attention received. Metrics collected by independent research groups show that actual goal differentials stayed within expected ranges despite the narrative buildup.
Thoroughbred Longshots and Platform-Driven Interest
In the lead-up to major summer racing festivals, long-priced entrants in handicap and stakes events frequently experience surges in social mentions after brief video clips of morning gallops circulate. Data aggregators tracking these conversations find that mention counts correlate more strongly with visual content than with official speed ratings or trainer win percentages. One study covering North American tracks during 2025 identified a subset of horses starting at odds greater than 20-1 that received three times the average discussion volume of shorter-priced rivals, while their historical success rate in equivalent conditions remained under four percent.
Similar patterns appear in European flat and jump racing where novice or lightly raced thoroughbreds attract attention through stable-related accounts. Analysts compare these volumes against tote and bookmaker data to quantify how public perception diverges from implied probabilities. The resulting datasets help identify instances where market odds move in response to sentiment rather than new information on ground conditions or pace scenarios.
Tools and Data Sources Employed by Analysts
Specialized platforms combine natural language processing with betting exchange feeds to measure real-time divergence scores. These systems flag fixtures or races where social sentiment exceeds a defined threshold relative to modeled probabilities. Regulatory bodies such as the American Gaming Association have referenced comparable analytics when reviewing market integrity reports, noting that volume spikes occasionally precede unusual betting patterns. Academic researchers from institutions including the University of Melbourne have published peer-reviewed work examining how platform algorithms amplify certain narratives in sports and racing contexts.
Cross-validation against official results databases allows analysts to calculate the frequency and magnitude of these perception gaps. Figures compiled over multiple seasons indicate that discrepancies occur more often in high-profile events than in lower-attention fixtures, suggesting visibility plays a measurable role in shaping online discourse.
Conclusion
Continued refinement of social media analytics provides clearer visibility into how public conversation diverges from statistical realities across football and thoroughbred racing. These tools document patterns without predicting future outcomes, yet they supply measurable benchmarks for comparing perception against documented probabilities in both sports.