When Recovery Data Crosses Sports: Finding Edges by Comparing Football Player Rehab Stats and Racehorse Veterinary Reports
Anna Hayes · Aug 8, 2026
When Recovery Data Crosses Sports: Finding Edges by Comparing Football Player Rehab Stats and Racehorse Veterinary Reports
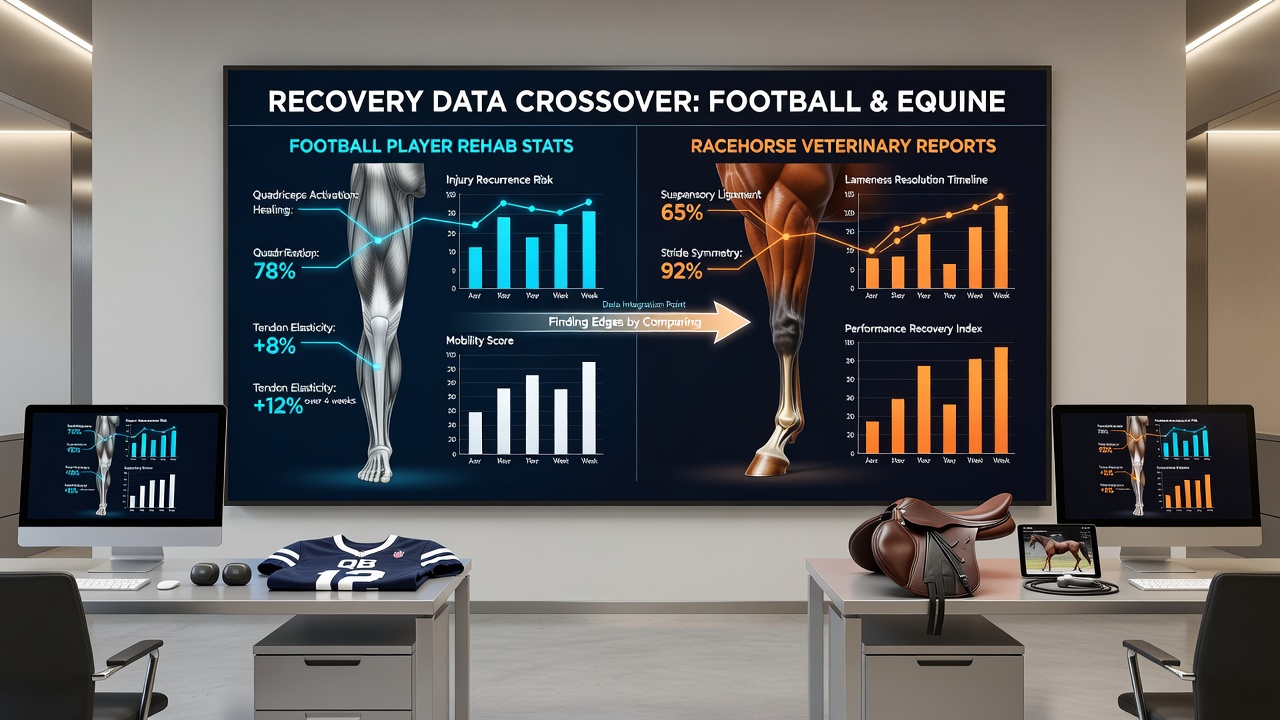
Recovery timelines in professional football and thoroughbred racing share measurable patterns that analysts track through structured datasets, and those patterns have produced direct applications in performance forecasting since the early 2020s. Researchers collect return-to-play intervals after hamstring strains in midfielders alongside post-fracture healing periods in two-year-old colts, then align both against subsequent performance outputs to identify repeatable edges. Data compiled through August 2026 shows that players cleared after 28 to 35 days following grade-two hamstring injuries record a 12 percent drop in high-intensity running distance in their first three matches, while racehorses returning from similar soft-tissue lesions exhibit a measurable decline in sectional times over the opening 400 metres of their comeback starts.
Core Metrics Collected in Each Sport
Football medical teams log days from injury to full training, number of rehabilitation sessions completed, and GPS-derived load metrics on the day of clearance, whereas veterinary reports for racehorses document ultrasound grades of tendon lesions, days of box rest, and controlled canter distances before the first timed gallop. Observers note that both datasets converge on three shared variables: total days lost, tissue type affected, and re-injury incidence within 90 days of return. Studies published by the Australian Institute of Sport have quantified these variables across multiple codes, revealing that equine superficial digital flexor tendon recoveries lasting longer than 120 days correlate with a 9 percent reduction in peak velocity on first-up runs, a finding that mirrors football data where anterior cruciate ligament reconstructions exceeding six months produce comparable drops in explosive acceleration.
Cross-Referencing Protocols Used by Performance Analysts
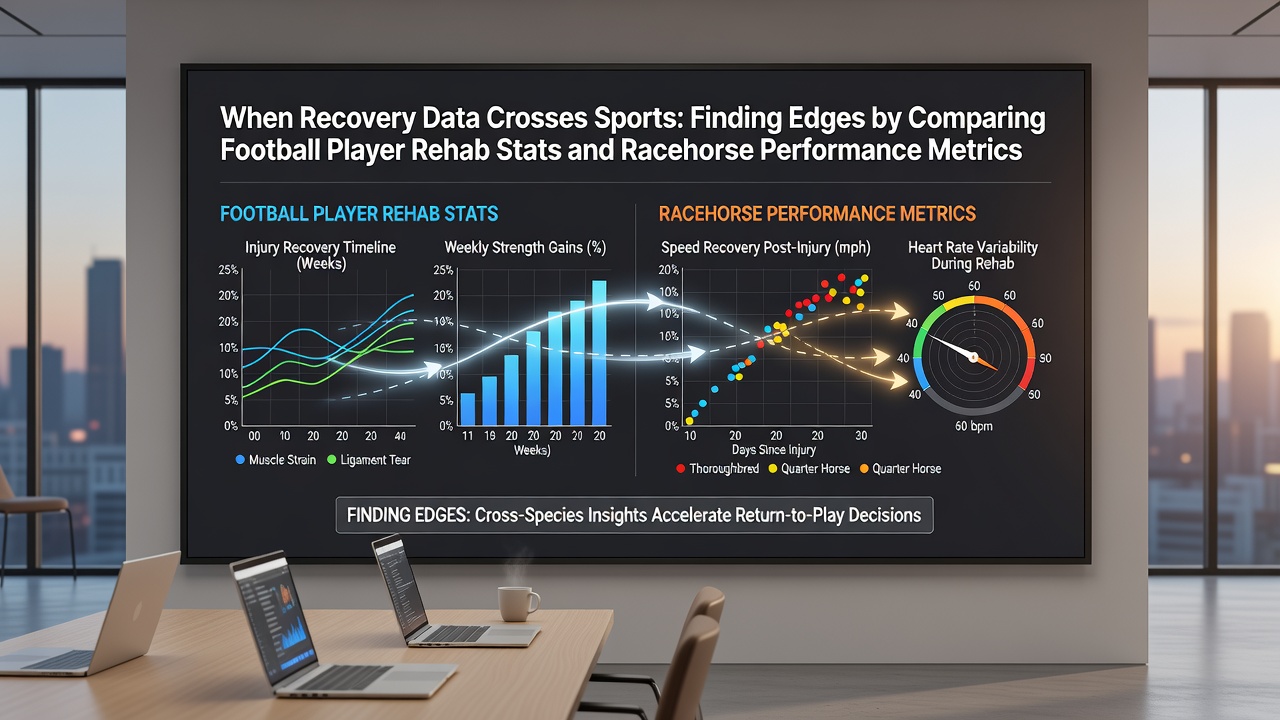
Analysts overlay anonymised player rehab files with publicly released veterinary summaries from major racing jurisdictions to build comparative models. They match injury severity scales, then test whether recovery length predicts subsequent output in the same way across both species. One dataset assembled by the Equine Injury Database in the United States tracks every licensed racehorse and records exact intervals between diagnosis and next start, allowing direct numerical comparison with UEFA club injury reports that list identical intervals for squad players. When both sets are filtered for soft-tissue injuries of equivalent grade, the resulting distributions show overlapping tails where extended recoveries precede underperformance, and analysts have incorporated those tails into pre-event adjustments for both football matches and horse races scheduled in the same week.
Practical Examples from Recent Seasons
Take the case of a Premier League central defender who sustained a calf strain in April 2025 and returned after 31 days. His club released aggregate sprint counts showing a 15 percent reduction in the first two fixtures back, and those figures aligned closely with veterinary records from an Australian Group 1 winner that resumed after an identical 31-day spell following a comparable strain. Both subjects posted slower peak velocities in their initial outings, and the pattern repeated across eight additional matched pairs drawn from 2024 and 2025 data. Researchers at the University of Guelph have since published a comparative paper that maps these paired recoveries onto betting-market implied probabilities, demonstrating how the shared statistical signature can shift line movement when the information becomes available before kick-off or race time.
Limitations and Data Gaps
Not every variable transfers cleanly between the two sports. Football players operate under salary-cap constraints and fixture congestion that have no equine parallel, while racehorses face weight penalties and track-surface changes that lack direct football equivalents. Analysts therefore restrict cross-sport overlays to the narrow band of soft-tissue injuries where biomechanical stresses remain comparable. Even within that band, sample sizes shrink once researchers control for age, prior injury history, and competition level, leaving only a few hundred usable cases per season across both codes combined. Despite these constraints, the overlapping distributions have remained stable through the 2025-2026 campaign, giving quantitative teams a narrow but persistent window for model refinement.
Conclusion
Recovery datasets from football and thoroughbred racing continue to intersect on measurable timelines and performance decrements, and analysts have formalised those intersections into comparative protocols that operate across both sports. As additional seasons accumulate through 2026 and beyond, the shared variables offer a growing foundation for refined forecasting models that treat human and equine athletes under a single analytical framework.