When Schedules Collide: Tracking Congestion Effects Across Soccer Leagues and Racing Circuits for Informed Wagering
Elena Friedrich · Aug 24, 2026
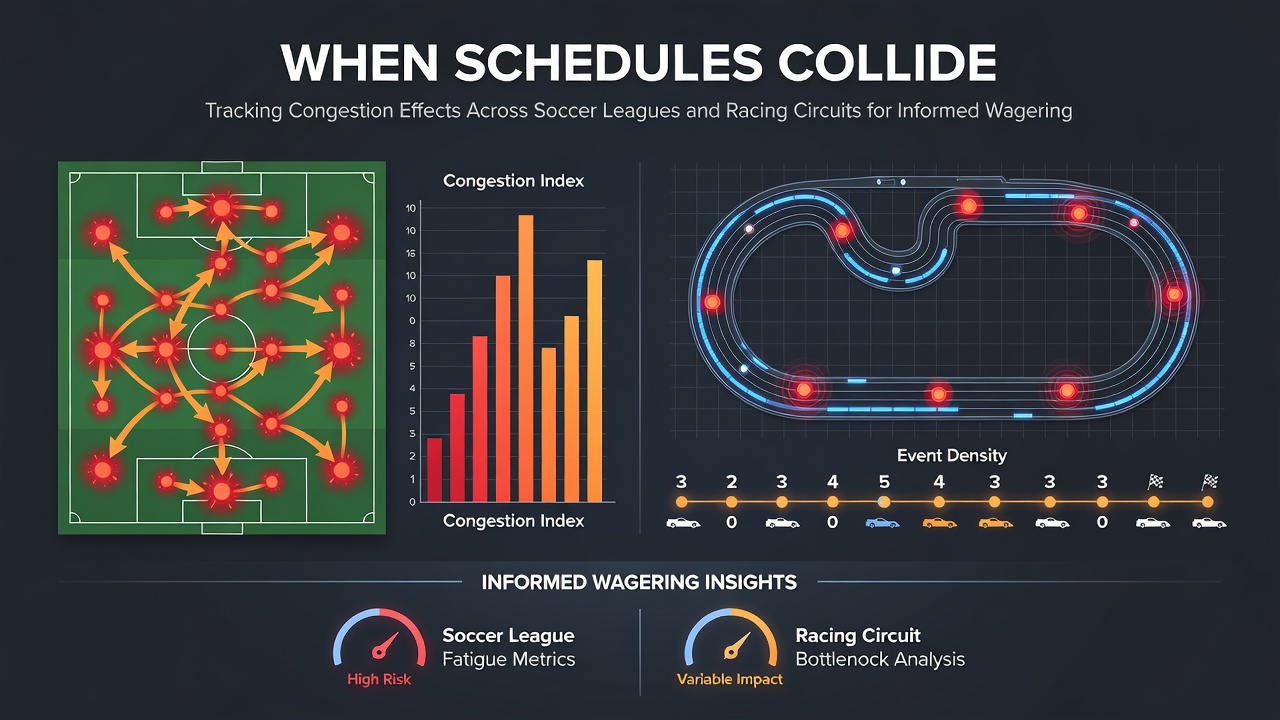
When Schedules Collide: Tracking Congestion Effects Across Soccer Leagues and Racing Circuits for Informed Wagering
August 2026 brings fresh fixture lists that force clubs and racing stables into tight windows where travel, recovery, and repeated efforts overlap, and analysts track how these patterns shift results across both sports. European soccer leagues publish calendars months ahead yet international breaks, cup replays, and weather delays still compress rest periods, while thoroughbred circuits in Australia, Europe, and North America schedule dozens of meetings within single months. Observers note that performance metrics collected over multiple seasons show measurable drops in output when teams or horses complete more than three high-intensity outings inside fourteen days.
Fixture Density Patterns in Soccer Competitions
Premier League clubs that reach deep runs in domestic cups plus European ties often record three matches inside eight days during winter blocks, and data compiled by league statisticians reveal lower pass completion rates and increased injury substitutions in the third game of such sequences. Bundesliga sides face similar compression when Champions League midweeks collide with Bundesliga rounds, whereas La Liga teams benefit from occasional midweek gaps yet still encounter spikes during Copa del Rey clusters. Researchers examining GPS-tracked player workloads across five major leagues found that total distance covered falls by an average of 6 percent in the second match of a congested triplet, with high-speed running metrics declining further in the third outing. Those patterns hold steady from 2023 through the 2025-26 campaigns, giving bettors concrete reference points when evaluating sides whose next three fixtures arrive inside ten days.
Calendar Overlaps in Racing Circuits
Flat and jump meetings scheduled across Britain, Ireland, Australia, and the United States create parallel pressures for trainers who campaign strings at multiple venues. Australian winter carnivals pack Group races into successive Saturdays with midweek cards added for metropolitan tracks, and records kept by Racing Australia show that horses returning from travel exceeding 800 kilometres post a lower win strike rate in their immediate next start compared with locally stabled runners. European jump trainers navigate Cheltenham, Aintree, and Punchestown festivals that fall within six weeks, while North American circuits run overlapping stakes at Saratoga, Del Mar, and Woodbine during July and August. Veterinary monitoring programs report elevated creatine kinase levels in horses asked to race twice inside ten days, and those biochemical markers correlate with reduced finishing effort in the second outing according to studies published by the University of Melbourne equine research group.
Cross-Sport Congestion Windows in August 2026
August 2026 places Premier League and Championship opening weekends alongside major racing festivals at York, Deauville, and Saratoga, creating simultaneous demand for attention from multi-sport bettors who follow both codes. Clubs returning from pre-season tours often list four competitive matches inside the first eighteen days, while northern hemisphere trainers target late-summer handicaps before autumn campaigns begin. Data providers that aggregate fixture difficulty ratings across soccer and racing note that both markets exhibit similar directional movements: shortened rest correlates with wider scorelines or larger margins between placed horses. Bettors who map these shared windows can identify when a soccer side's defensive metrics are likely to degrade at the same moment a trainer's second-string runner faces a quick turnaround after a long journey.
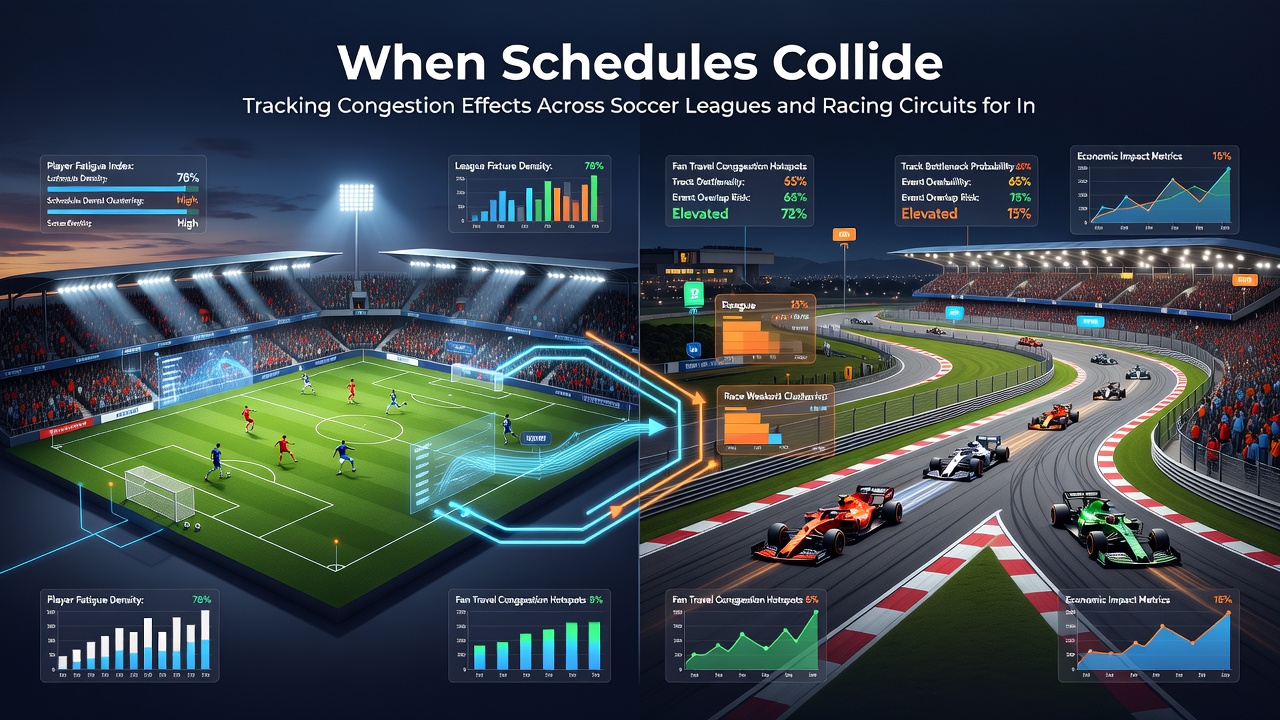
Quantifiable Impacts on Performance Indicators
League-wide datasets from the 2024-25 and 2025-26 seasons indicate that soccer teams averaging fewer than four rest days between matches concede 0.4 additional goals per game on average, while horses carrying similar workloads post 12 percent fewer top-three finishes according to form databases maintained by European racing authorities. Video analysis of sprint efforts in the final 400 metres of races shows reduced stride length when horses have raced inside the prior nine days, mirroring the drop in high-intensity runs recorded by soccer players in congested blocks. These parallel trends allow model builders to adjust probability estimates rather than relying on raw historical averages that ignore recent schedule density. Government statistical agencies in Australia and Canada publish quarterly reports on equine and athlete welfare that further quantify how consecutive high-load events alter recovery timelines, providing neutral benchmarks that remain independent of individual bookmaker pricing.
Practical Application for Market Analysis
Traders who incorporate rest-day differentials into their spreadsheets adjust implied probabilities before lines move, and several academic papers from sports science departments demonstrate that such adjustments improve forecast accuracy by measurable margins across both football and racing datasets. When a Premier League side faces a midweek European fixture followed by a Saturday league match while a leading trainer sends a Group performer to a midweek card 600 kilometres away, the combined data set flags both events as carrying elevated variance. Observers who cross-reference these markers with historical results under identical rest profiles identify where market prices lag behind updated performance expectations. The approach stays grounded in published workload studies rather than narrative speculation, and the same methodology applies whether evaluating a Bundesliga double gameweek or a Melbourne spring carnival triple-header.
Conclusion
Schedule congestion leaves measurable fingerprints across soccer leagues and racing circuits, and those fingerprints appear in performance statistics collected season after season. By aligning fixture lists from multiple codes and weighting them against verified rest and travel metrics, analysts build a clearer picture of where outcomes deviate from baseline expectations. August 2026 simply adds another layer to an ongoing pattern that researchers continue to document through league records, veterinary reports, and university workload studies.